

The Young are not Voting.
The boomers really did take everything, but the young let them do it by staying home.

This note describes an analysis of the State of Illinois voter history data, taken from 3/2022. This analysis shows that voters in the 20-30 y/o age bracket are approximately three times less likely to vote than voters in the 50-60 age bracket.
The State voter data is further combined with FEC donation data in order to associate voter occupations and employers. The frequency of votes cast by occupation is found to be dominated by occupations that require a college degree.
I think a key to understanding our current political problems, and actually solving them, is the understanding that everything important is documented on publicly visible score keeping systems. One such important system is the FEC donation dataset, which has online data back to the 1980 cycle. In these records, a donor must give their employer. This allows the two political parties to measure the effect on donations from legislation that includes Federal subsidies to private corporations.
Cursory analysis of this data reveals that so called “large donors” contribute >90% of non PAC dollars into the FEC system and that these donors are overwhelmingly employed by employers that receive Federal subsidies —> FEC analysis.
The visibility that the FEC dataset gives the two political parties appears to have driven subsidy based legislation for the last 40 years with many, many bad outcomes, such as the lack of a high speed rail system.
Another such important public data set is the State voter history data from all 50 states. These databases were Federally mandated in 2002. Each state must make available for purchase its list of registered voters and the history of which elections they voted in. These databases are used exhaustively by the political parties for the purpose of winning elections. These databases contain the voter’s addresses and are also used for gerrymandering voter districts.
I was able to obtain a copy of the Illinois voter data from an Illinois PAC, Progressives of Kane County. They had purchased the data in March of 2022 for $500 from the State for the purpose of recruiting candidates to run for local offices.

The data for each voter includes a “last activity date” field. The distribution above is made with this data field for the 8 million voter records in the database. If a voter does not vote in 8 years they are expired from the database. The State database was copied on 3/2022 as indicated by the right side range of the x axis.
The database also contains the current age of each registered voter. This distribution is shown below:

This data shows a relatively flat distribution, with a few edge like systematics, followed by an exponential decay curve above age ~65. The edges are presumably algorithmic in origin. These are likely from one time database operations notionally intended to delete inactive voters. If this distribution were made from the dataset from a different year, the systematics should move. The decay curve on the right is driven by Human mortality.
The state database also contains a list of dates of all elections that each voter has voted in. If we make a similar distribution as above, but for the age of each voter when they cast each specific vote, we get the following distribution:

Aside from being a remarkable example of a Gaussian curve formed from real data, this distribution shows that younger voters are being outvoted by older voters by a factor of ~3X. The previous plot showed that the number of voters was relatively constant across the age range 20-60. The plot above shows that voters in the 20-30 y/o range are outvoted by a factor of 3 by voters in the 45-55 age range.
If we combine the two plots above, and take a guess at the absolute normalization, we get the following:

The horizontal distance between the two curves on the right side is approximately 8 years, which is the voter inactivity expiration time.
This data on the left hand side shows that there is a large pool of younger voters who are not casting votes.
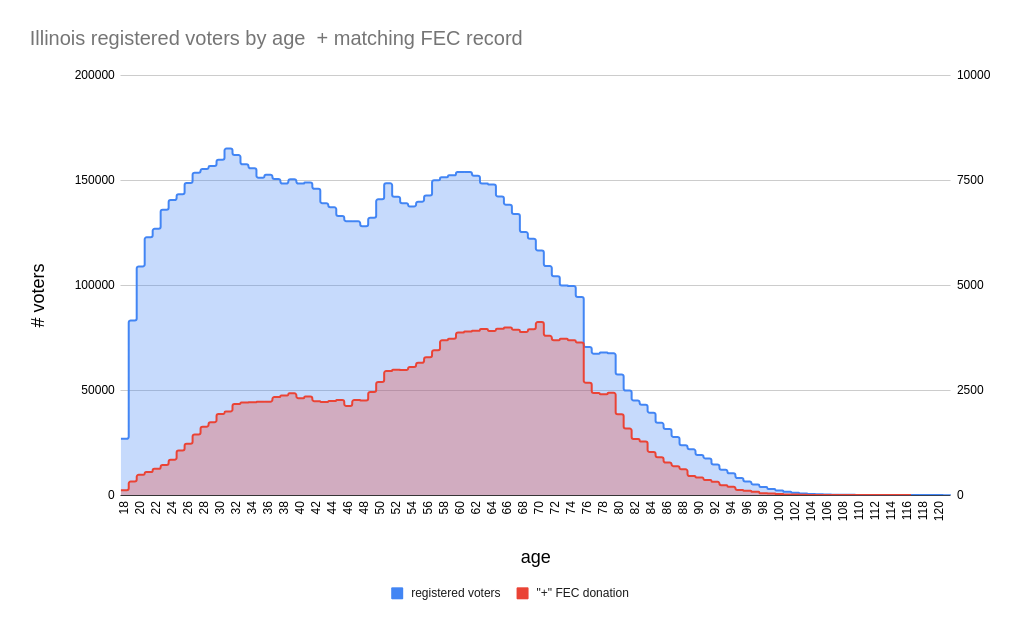
Next, we match the name and city of each voter in the FEC data with the corresponding name and city in the state voter history data. This allows the occupation and employers to be counted by voter frequency. The distribution of registered voters + a matching FEC record is shown in red below. Note that the vertical scales are arbitrary and that there are only about 170K matched voters in the red distribution.
Using this combined data, we aggregate the number of votes cast by occupation below. Approximately half of all cast votes are shown in the sorted list. About 90% of the listed occupations in the list require a college degree.

The same plot can be made for voter employer as shown below.

These distributions were largely similar for primary and general elections.
This analysis indicates that there is a large pool of young voters that could be motivated to vote in the 2024 primaries and general election. The following data is from a recent City Council race in Aurora Il. This shows the results of a Facebook/Instagram targeted advertising campaign. A list of 20K voters was targeted by name. The results of the campaign are that ~50% of the voters were reached, on average 10 times at a cost of ~25 cents per reached voter.

When currently young people say that the baby boomers stole everything in the economy, they are correct. Voting in the primary and general elections is dominated by middle aged, college educated professionals. I think the takeaway is: if a person is thriving, they will not vote for change. This is why party outsiders consistently lose in the primaries; because the people doing the voting like things the way they are and are not going to vote for change.